A technique that traders and investors can use in order to benefit in their investments or trading decisions is the Fibonacci Analysis. This technique is very useful in shaping entry levels in multiple time frames and all market situations.
Leonardo Fibonacci was an Italian mathematician who discovered these techniques in the 12th century. He analyzed a series of numbers and the relationship of one number to another. In this sequence of numbers, each number apart from the first two is the amount of the two previous numbers.
For example, 2+3=5, 3+5=8.
1, 1, 2, 3, 5, 8, 13, 21, 34, 55, 89, 144
Additionally, if we take a number in the sequence and divide it with the next one, it will provide us with the ratio of 0.168. For example, if we take the number 89 from the sequence and we divide it with the next one (144), the ratio provided is 0.16805556.
Also, by taking a number in the series and divide it with the two next higher numbers, the ratio will be equal to 0.3819. For example, if we take the number 21 and divide it with the number 55, the ratio will be 0.38181818.
All these ratios, 1.62, 0.62 and 0.38 and the percent of these ratios are identified as the Fibonacci Levels.
Fibonacci Levels

Golden Ratio
What is Fibonacci Analysis

Resources
-
Constance Brown (2008), Fibonacci Analysis, Wiley, John & Sons, Incorporated, Bloomberg Press, New York, USA.
-
Goetzmann, William N. and Rouwenhorst, K.Geert, The Origins of Value: The Financial Innovations That Created Modern Capital Markets (2005, Oxford University Press Inc, USA)
-
A. F. Horadam, "Eight hundred years young," The Australian Mathematics Teacher 31 (1975) 123-134.
-
Dickson, L. E., History of the Theory of Numbers, Vol. 1, 1952, pp. 393-407
Other sources
-
RICHARD E.GRIMM, THE AUTOBIOGRAPHY OF LEONARDO PISANO, [Available at http://www.fq.math.ca/Scanned/11-1/grimm.pdf], University of California, Davis, California, [Assessed on:17 April 2012]
A notable relationship of numbers can be identified by dividing one Fibonacci number by the previous one in the sequence, which will give you the ‘Golden Ratio’ of 1.618. To be more specific, the Golden Ratio is a particular number equal to 1.617977528089888. If we take the last number in the series above (144) and divide it with the previous number (89), the result will be the Golden Ratio.
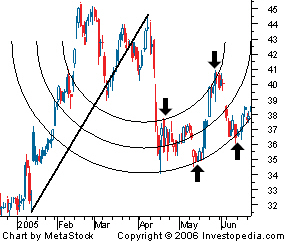
Fibonacci Arc
The Fibonacci Arc is a technique abiding of three curved lines aiming to predict important support and resistance levels, and areas of ranging.
This technique can be drawn by inserting an invisible trend line between two points and then drawing three curves that overlap this trend line at the key Fibonacci levels of 38.2%, 50% and 61.8%.
Traders can make a decision when the price of the asset overlaps these key levels.
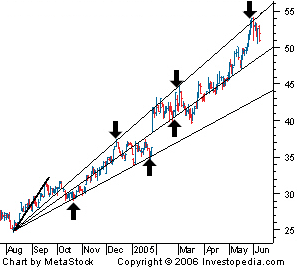
Fibonacci Fan
A Fibonacci Fan is a charting technique that involves three diagonal lines that use Fibonacci Rations to assist in identifying important levels of support and resistance.
First you draw a trend line through two points and there on by dividing the vertical distance between the two points by key Fibonacci ratios of 38.2%, 50% and 61.8%.
Each of these divisions represents a point within the vertical distance. When drawing a line starting from the point on the left to each of the three points, they create the ‘Fan’ lines and they represent a Fibonacci ratio.

Popular Fibonacci indicators
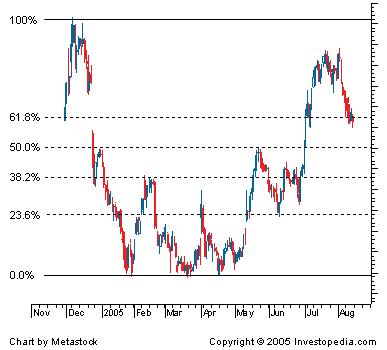
Fibonacci Retracements
The Fibonacci Retracements are a technical analysis tool that represent areas of support and resistance and are represented by a trend line drawn between a considerable low and high. For example, if the trend is going up, the retracement lines will decent from 100% to 0%. If the trend line is dropping, the retracement lines will climb from 0% to 100%.
This is a very popular technique used by technical traders in order to assist identify strategic spots for transactions to be placed. Moreover this technique is used in many indicators such as the Elliot Wave theory, the Tirone levels and many more. The new support and resistance levels caused by an important price movement, will probably going to be found at or near these lines.
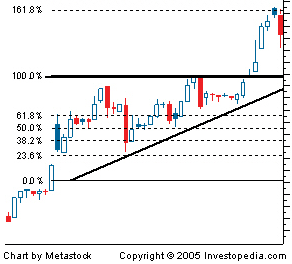
Fibonacci Extrensions
Fibonacci Extensions are levels used in Fibonacci Retracement in order to forecast areas of support and resistance. These extensions have to do with all levels drawn further than the standard 100% level and traders use this for identifying areas where they will wish to take profits.
The most popular extension levels are 161.8%, 261.8% and 423.6%.
These Fibonacci Extensions are used by traders in combination with other indicators in order to identify suitable target prices.
Fibonacci Analysis
Featured Brokers


Financial
Indicators